1. Introduction
This report presents the development and backtesting of a simple algorithmic trading strategy that capitalizes on the relative performance difference between Gold Futures (GC=F) and the SPDR Gold Shares ETF (GLD). The strategy is designed to identify mean-reversion opportunities by comparing the normalized percentage growth of both instruments.
2. Strategy Methodology
The core trading signal is derived from the percentage point difference in performance between Gold Futures and GLD ETF, both normalized to a base of 100. When the futures outperform the ETF by more than 0.3 percentage points, the strategy takes a long position in GLD, expecting mean reversion. Conversely, if GLD outperforms by the same threshold, the strategy shorts GLD.
3. Backtest Setup
Data used includes one year of daily prices for both GC=F and GLD downloaded from Yahoo Finance. Returns are calculated based on the previous day’s signal. Key performance metrics are computed to evaluate the efficacy of the strategy.
4. Performance Analysis and Observations
The chart below visualizes the cumulative return of the spread-based strategy compared to a simple buy-and-hold approach on GLD.
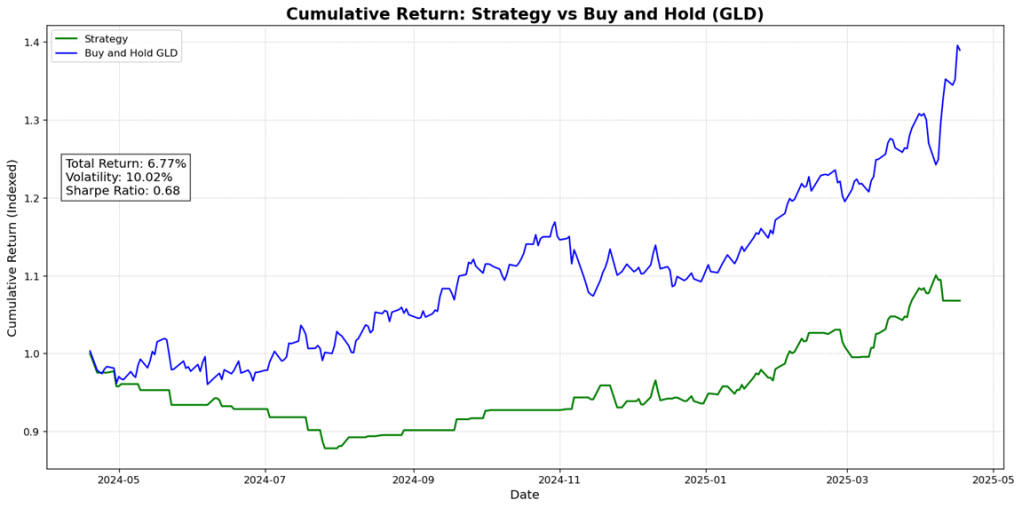
The strategy chart compares the performance of a rule-based long-short strategy on GLD ETF with a simple buy-and-hold approach. The key insights from the visual and metrics are as follows:
1. Underperformance Compared to Buy-and-Hold
Despite periods of modest gains, the strategy underperformed the buy-and-hold benchmark over the past year. The strategy’s cumulative return is 6.77%, whereas the buy-and-hold portfolio on GLD achieved a return closer to 39%, as evident from the visibly steeper and more consistent upward trajectory of the blue line.
This disparity suggests that while the difference between gold futures and GLD ETF does provide signals, they might not be consistently profitable or timely enough to outperform passive holding in a strong bull market.
2. Volatility and Risk Management
The strategy exhibited volatility of 10.02%, which is relatively moderate. This shows the strategy did avoid some large drawdowns by exiting trades when differences normalized. The strategy was less exposed during turbulent market phases, reducing downside risk but also missing out on some upside potential.
3. Sharpe Ratio (0.68)
The Sharpe ratio of 0.68 reflects moderate risk-adjusted performance. A ratio above 1.0 is generally considered good, indicating that this model could benefit from additional filters (e.g., macroeconomic overlays or volume confirmation) to enhance return potential without significantly increasing risk.
4. Lag in Capturing Trend Breakouts
The strategy uses a simple threshold-based entry/exit rule (±0.3% difference). While this ensures frequent participation, it also leads to whipsaws—entering or exiting too quickly—especially during breakout or trend-following phases. This is apparent in the flat or choppy green line performance between mid-2024 and late 2024, where price divergence persisted but reversals occurred too soon or too often.
5. Periods of Outperformance
There is a brief period around February to March 2025 where the strategy line (green) begins to rise more sharply. This coincides with increased volatility and divergence between futures and ETF prices—likely due to macroeconomic developments such as rising interest rate expectations, geopolitical tensions, or inflationary pressures. This suggests the model may perform better during turbulent, news-driven environments rather than stable upward trends.
6. Improvement Suggestions
To improve the strategy:
- Adjust the threshold dynamically based on volatility (e.g., using a z-score of the spread).
- Add trend or momentum filters to reduce whipsaws.
- Incorporate macro signals (e.g., CPI surprises, real rates) to time entries more effectively.
- Test asymmetric thresholds or position sizing.
