
ETFs (Exchange-Traded Funds) are a crucial component of any well-rounded investment strategy. They offer broad market exposure, helping to diversify risk and generally exhibit strong historical performance.
In this report, we delve into the historical performance of leading ETFs, such as SPY and QQQ, using Python to analyze price changes across various months and years.
This analysis aims to provide valuable insights to help you refine and optimize your investment strategy.
Overview
This Python script is designed to perform an analysis of historical price data for a specific ticker. It fetches the data using the Interactive Brokers API, processes it to calculate monthly percentage changes, and generates various plots and statistical summaries.
Main Script

Key Steps:
- Define Inputs:
- The ticker symbol, end date, duration, and timeframe are specified.
- Import Libraries:
- Necessary libraries such as pandas, matplotlib, and IB API client and wrapper are imported.
- Logging Configuration:
- Logging is set up to capture information.
- TradeApp Class:
- Inherits from
EWrapperandEClientto fetch historical data and store it in a pandas dataframe.
- Inherits from
- Contract Definition:
- A function
usTechStkdefines the contract for the specified ticker.
- A function
- Historical Data Request:
histDatafunction requests historical data using the IB API.
- WebSocket Connection:
- A separate thread starts the WebSocket connection to ensure data fetching.
- Data Processing:
- The fetched data is processed to calculate monthly percentage changes, positive/negative changes, and their counts.
- Calculating Price Changes:
- A function
calculate_price_changescomputes the percentage change over 1, 5, 10, and 15 years.
- A function
- Plotting Results:
- The main plot shows the monthly percentage changes over 15 years.
- Additional plots display the number of positive and negative monthly price changes by month and by year.
Charts and Findings


Monthly Percentage Change (Past 15 Years)
The historical data analysis reveals a strong long-term upward trend for SPY, with substantial gains observed over 1-year, 5-year, 10-year, and 15-year periods. The distribution of positive and negative monthly changes by year highlights the ETF’s overall resilience and growth, despite periodic market corrections.
The period of highest volatility occurred in March and April of 2020, coinciding with the World Health Organization’s declaration of the Covid-19 pandemic. On average, positive months see a percentage increase of 3.292%, while negative months experience an average percentage decrease of 3.683%. Despite the higher average percentage decrease, there have been 119 months with positive price changes compared to only 61 months with negative price changes.
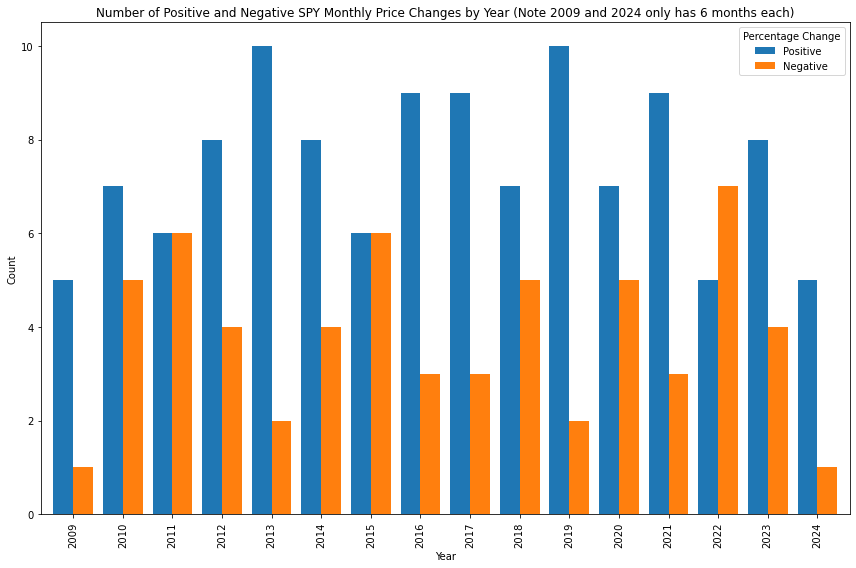
Positive and Negative Monthly Price Changes by Year
The bar graph depicting positive and negative monthly price changes by year shows the consistency of positive months across most years.
- Years like 2013 and 2019 stand out with a higher count of positive months, indicating strong bullish trends during these periods.
- Years like 2011 and 2015 show a more balanced count between positive and negative months, reflecting increased market volatility.

Positive and Negative Monthly Price Changes by Month
The bar graph depicting positive and negative monthly price changes by month shows the consistency of positive months across most months.
- Months like July and November stand out with a higher count of positive changes, suggesting that investing in SPY at the start of these months has historically had a higher probability of net positive gain by the end of the month.
Key Considerations
- Data Limitations: The analysis is based on historical data and past performance, which may not necessarily predict future performance.
- Market Volatility: Periods of high market volatility, such as 2018 and 2020, show that even strong performers like SPY can have significant negative months.
- Macro-Economic Factors: External factors such as economic policies, global events, and market sentiment can heavily influence ETF performance, which is not captured in this purely historical analysis.
Overall, the SPY ETF’s performance reflects its resilience and growth potential, making it a compelling option for long-term investors seeking consistent returns amidst market fluctuations.
Feel free to use the codes shared for your own tickers!
